ARC-AGI Dataset
Table of contents
2024 ARC-AGI Dataset
Let us begin with understanding the data.
Data format
All the data is JSON encoded, the structures of JSON are as followings (* stands for training , evaluation and test) :
- *_challenges
{ "task_id": { "test": [ { "input": [[...], ..., [...]] } ], "train": [ { "input": [[...], ..., [...]], "output": [[...], ..., [...]] }, ... ] }, ... } - *_solutions
{ "task_id": [[...], ..., [...]], ... } - submission format
{
  "task_id": [
      {
          "attempt_1": [[...], ..., [...]],
          "attempt_2": [[...], ..., [...]]
      },
  ],
  ...
}
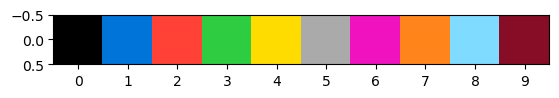
All the arrays have integer digits in range 0 to 9, and each element stands index of some hex_colors,
hex_colors = ['#000000', '#0074D9','#FF4136','#2ECC40','#FFDC00',
     '#AAAAAA', '#F012BE', '#FF851B', '#7FDBFF', '#870C25']
Visualization
Let’s visualize the data (I choose f35d900a and fcb5c309) Basically, we visaulize the data in 2d-grid with colors, however, we could treat the color values not as color channel but as positional values in z-axis, thinking that we applied one-hot encoding. The third one is colored 3-d scatter, just for highlights the z-level.
| f35d900a | fcb5c309 | |
|---|---|---|
| Basic | 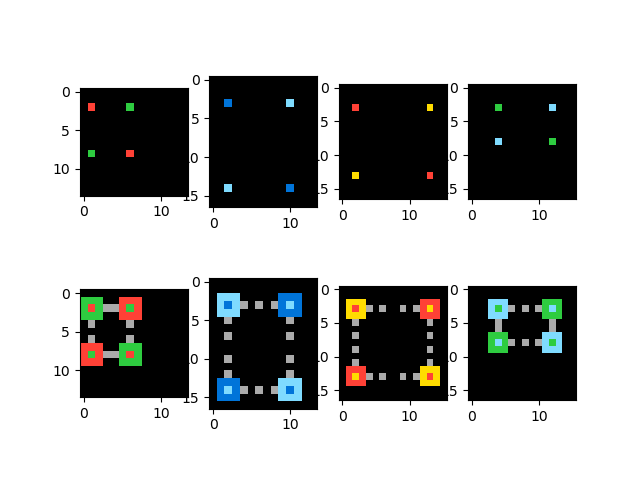 | 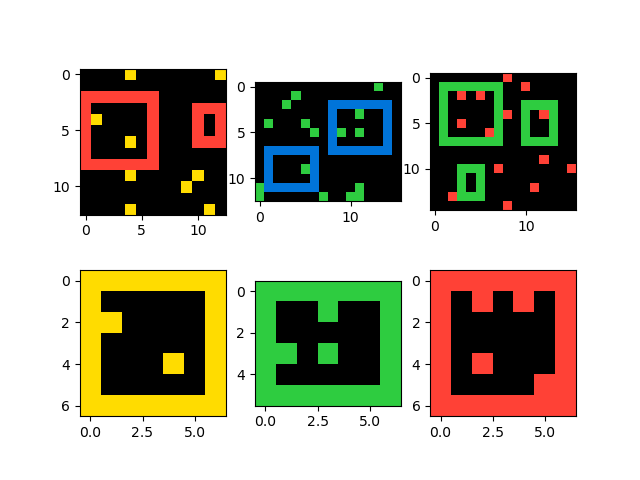 |
| 3d scatter | 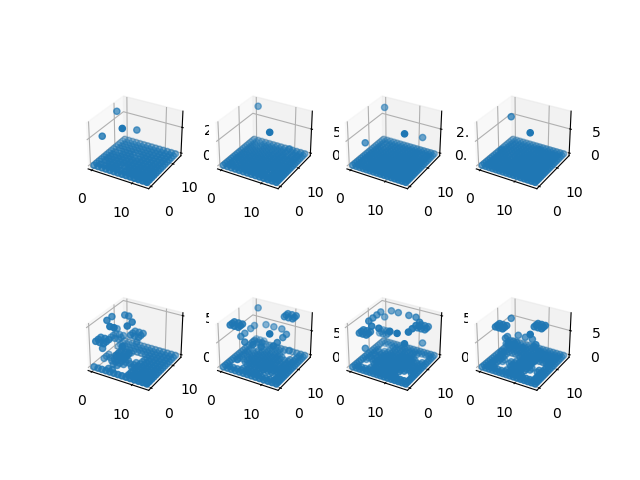 | 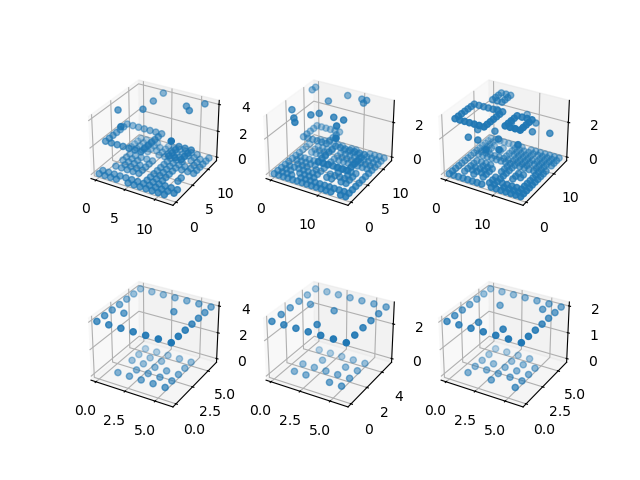 |
| 3d scatter (colored) |  | 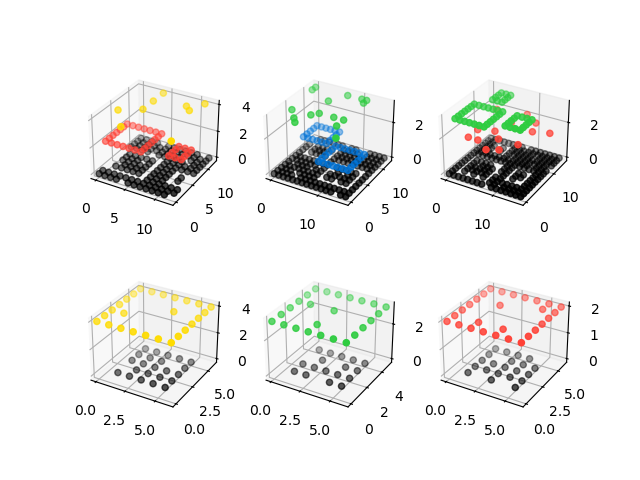 |